AI-powered
Spend Analytics
Faster decisions. Measurable results. Data-driven category strategies at the push of a button.
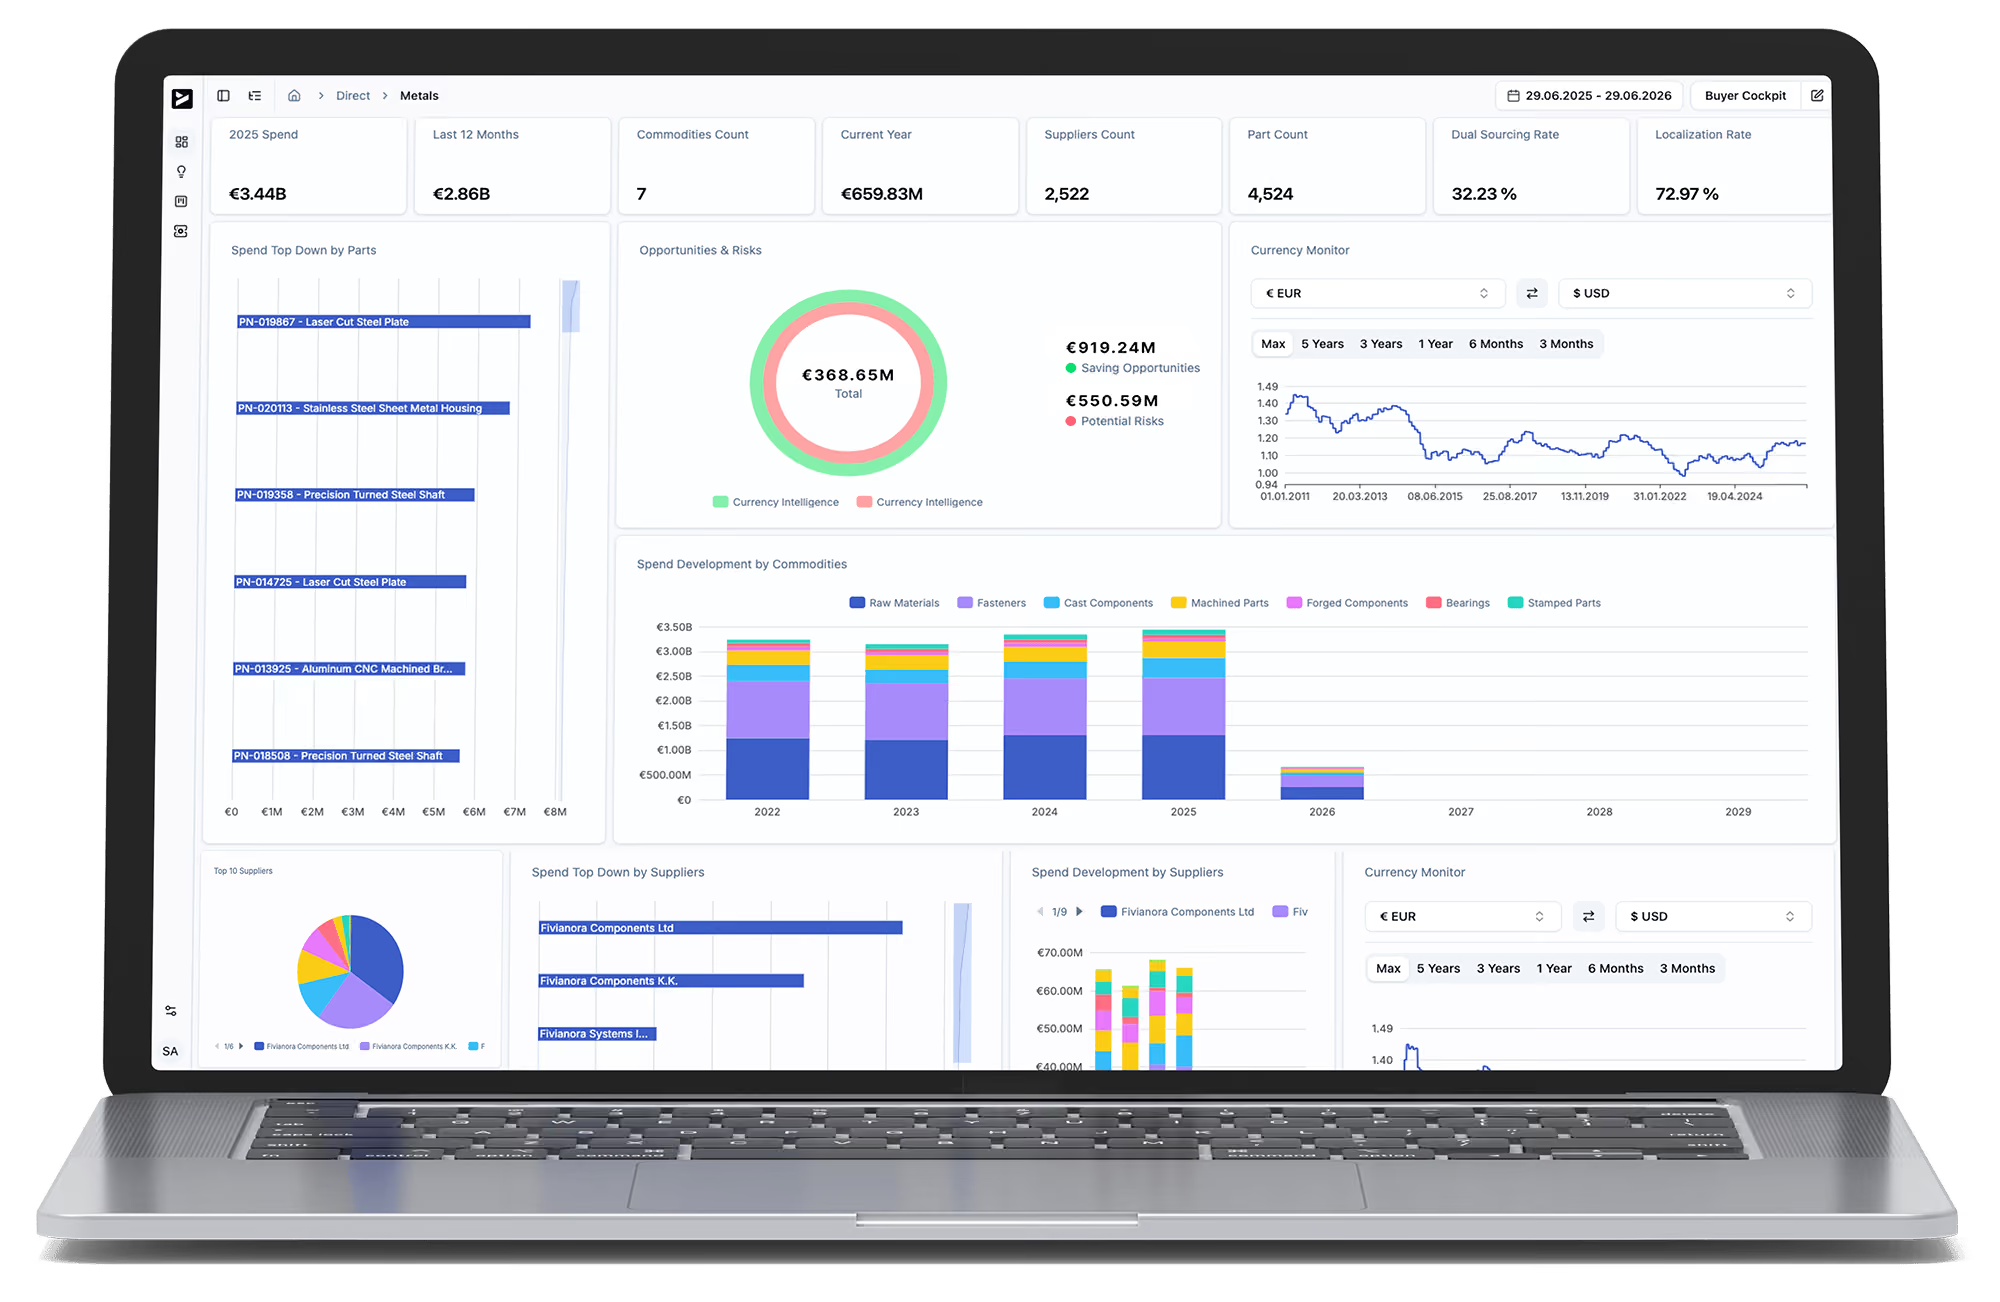
Get a real-time view of your direct spend, supplier performance, and market benchmarks — without the manual effort. Our AI automatically surfaces cost drivers, risks, and savings potential across product group, supplier, and part levels. Simulate strategic levers, understand their impact instantly, and translate complex data into clear recommendations with defined next steps.
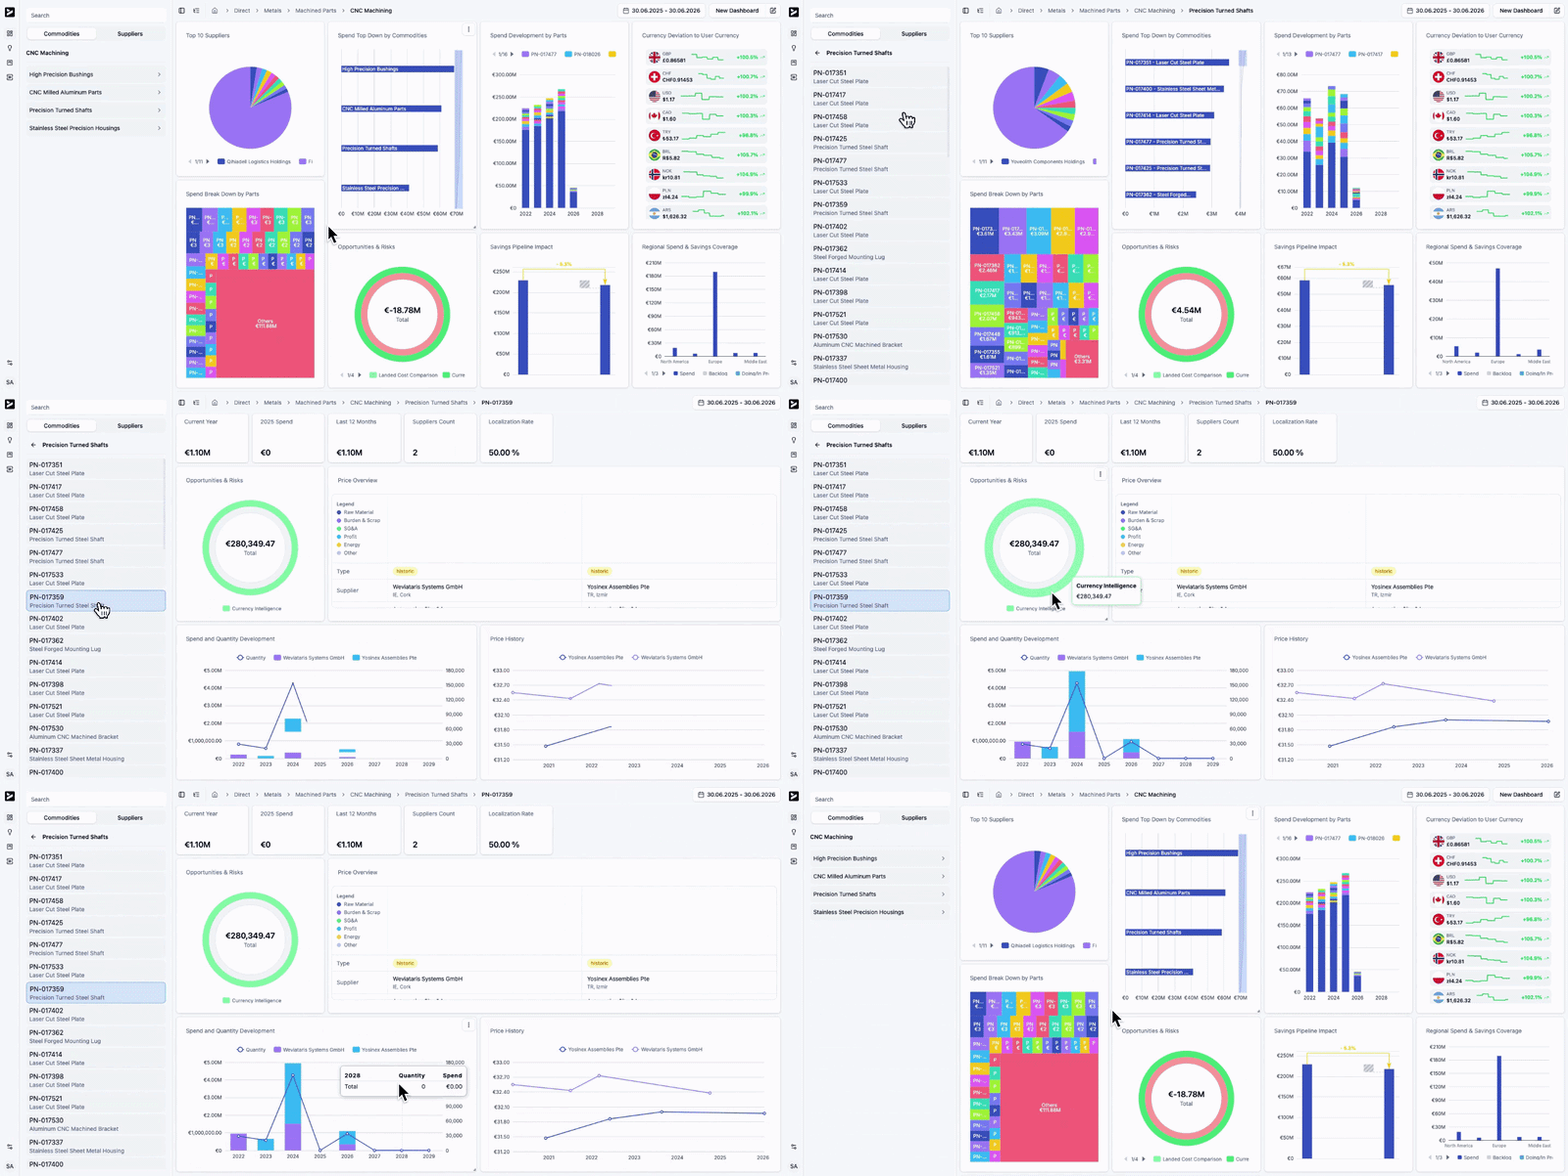
AI-powered spend analytics dashboards
enable you to make data-based decisions.
Categories and part families
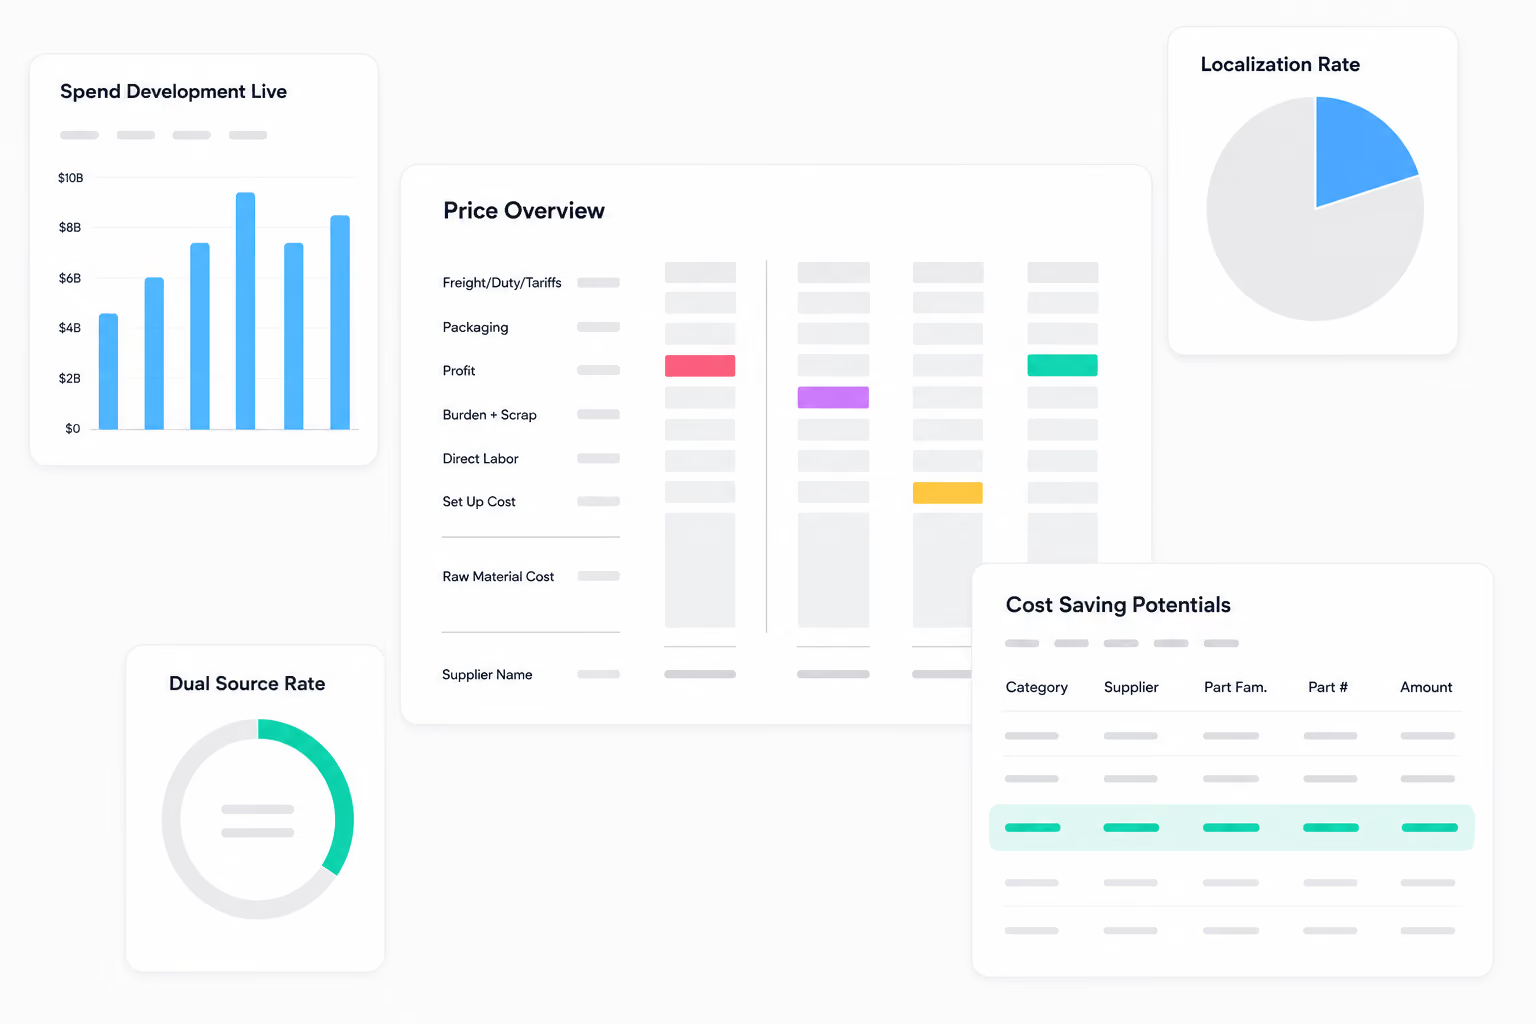
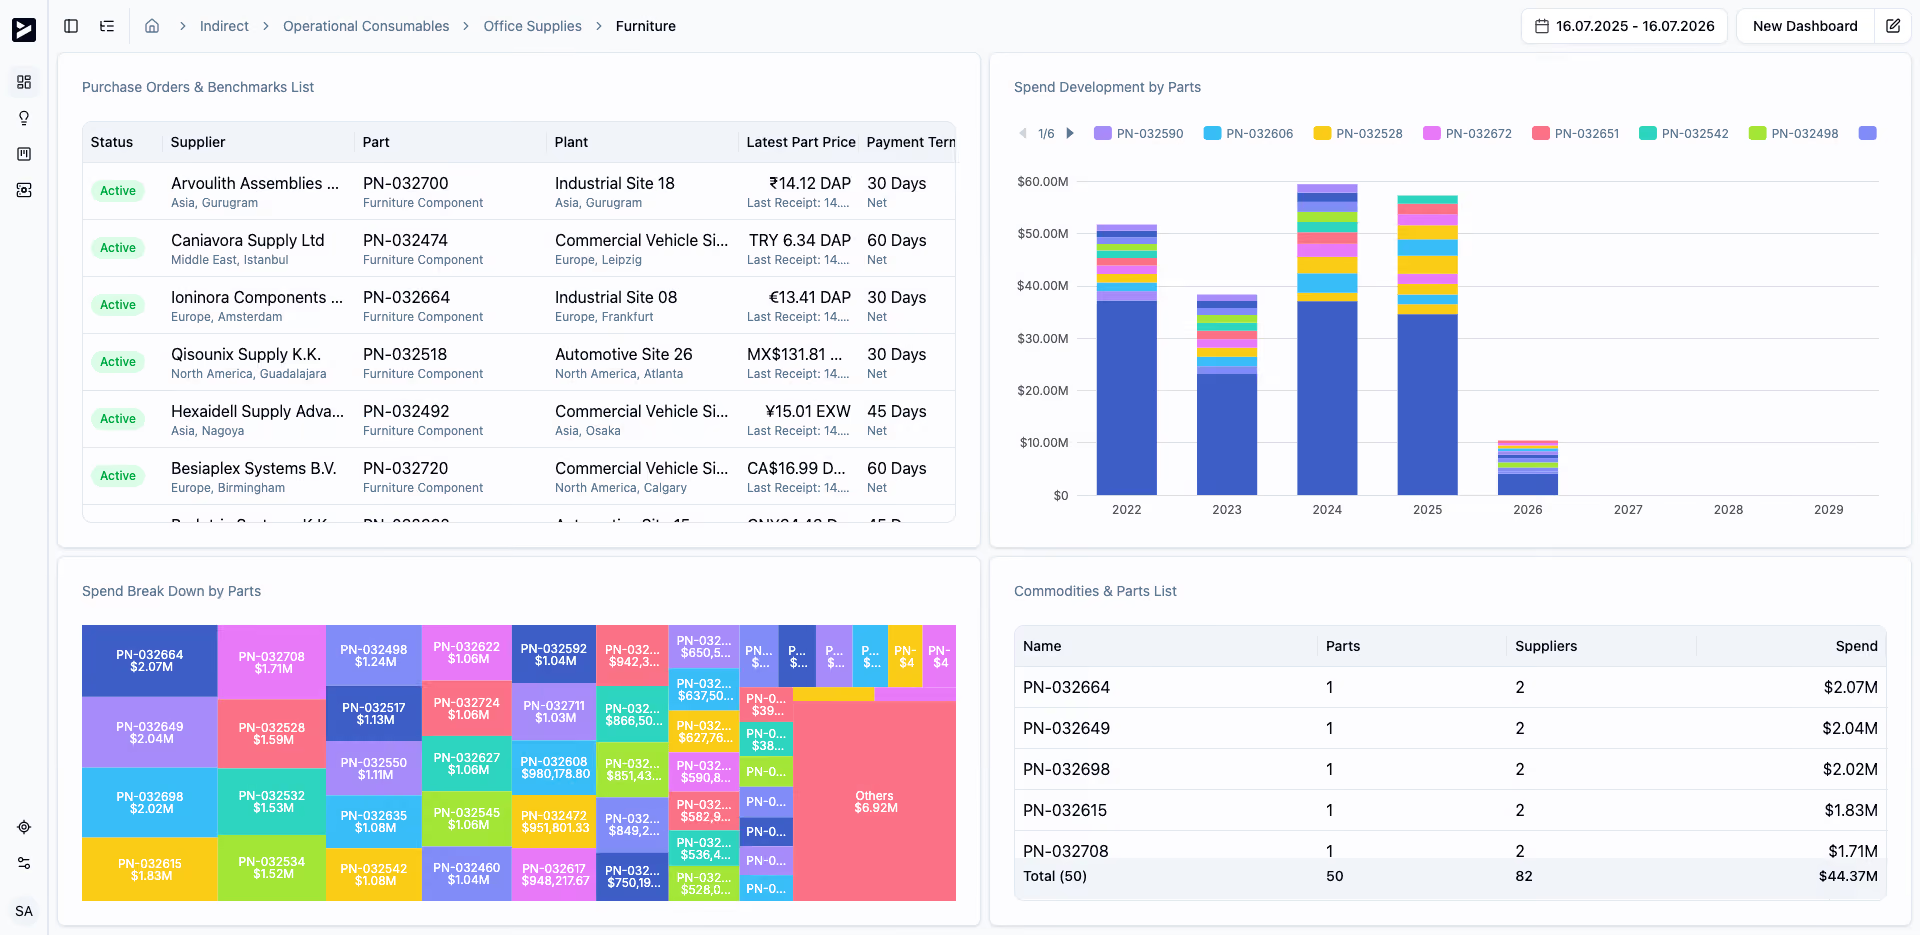
Clear and intuitive dashboards and lists give you direct access to product groups and parts families. The drill-down function provides you with information at part number level and a quick insight into framework agreements with your suppliers.
Part numbers
The dashboard provides you with a holistic overview at part number level, including:
- Localization rate
- Dual sourcing rate
- Deviation from target price or cost model
- Price trends
- Insight into all orders and contracts
- Comparison and creation of offers and benchmarks
Suppliers
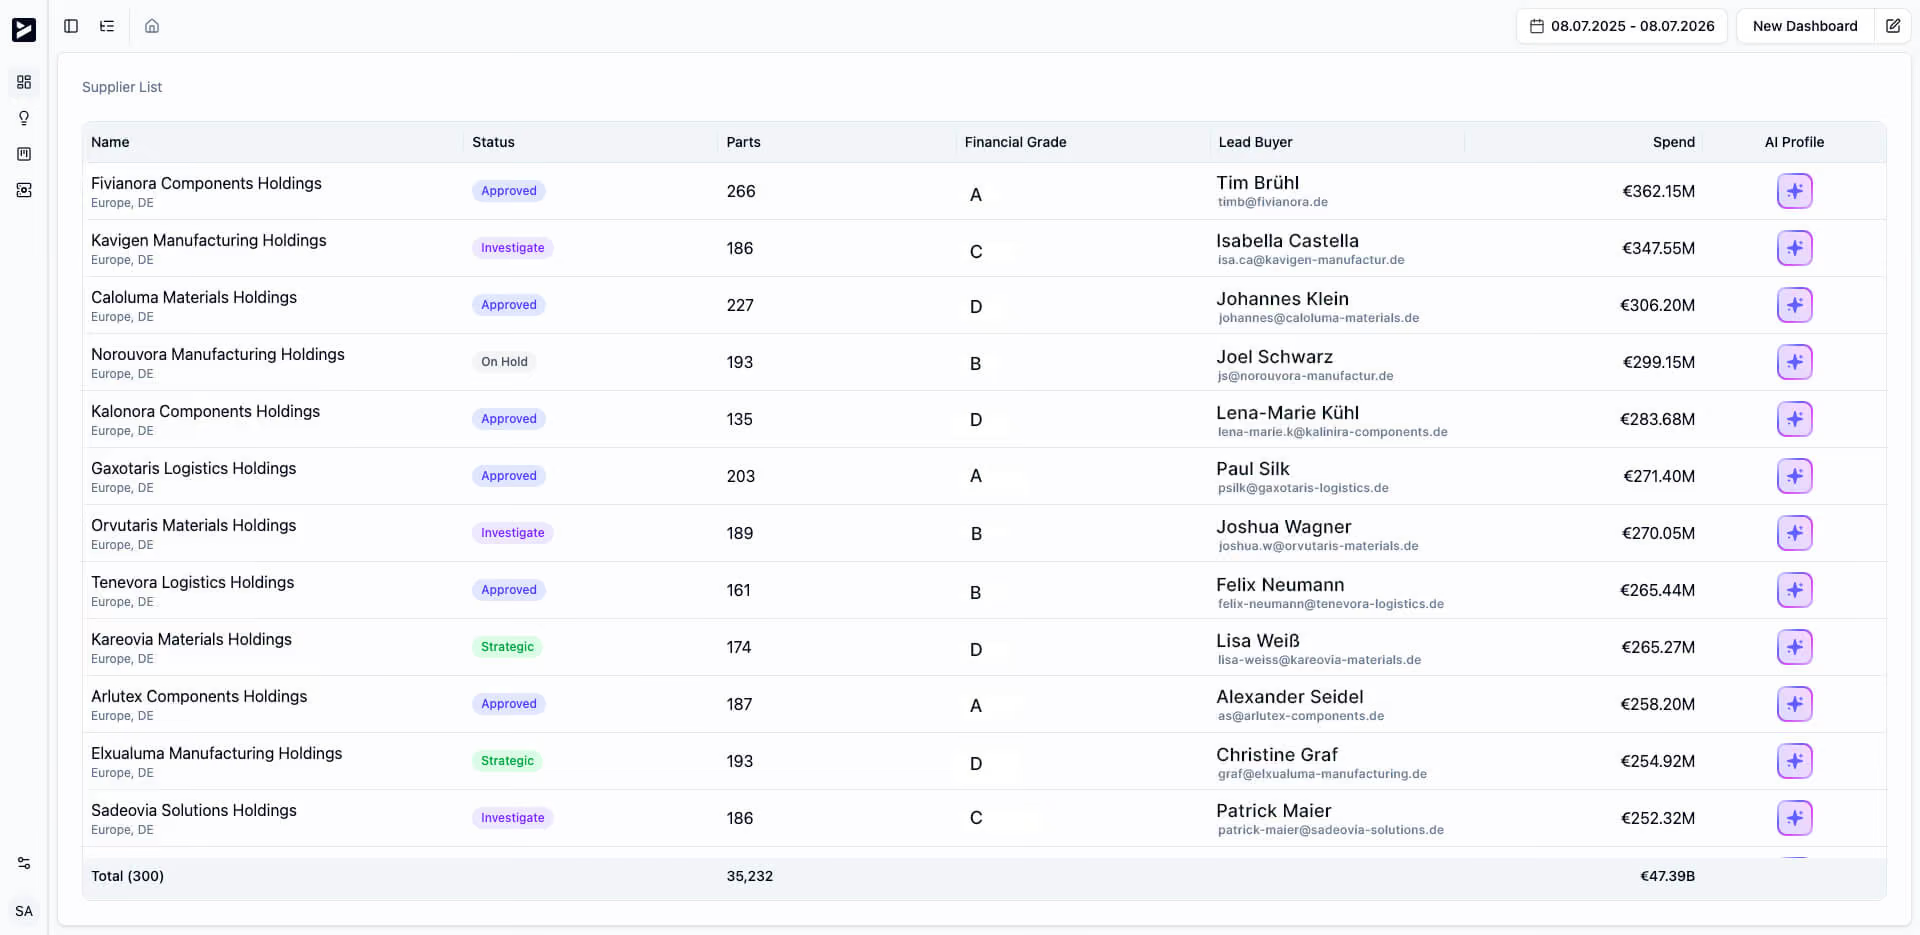
The supplier dashboard or supplier lists provide easy access and control over suppliers and their individual supplier codes.
- Prices and terms of payment
- Overview of your suppliers' expenditure and savings
- Financial stability
- Deviations from target agreements
- Compliance and sustainability
- Part families and high runners
- Cost saving potentials and risks
Supply chains
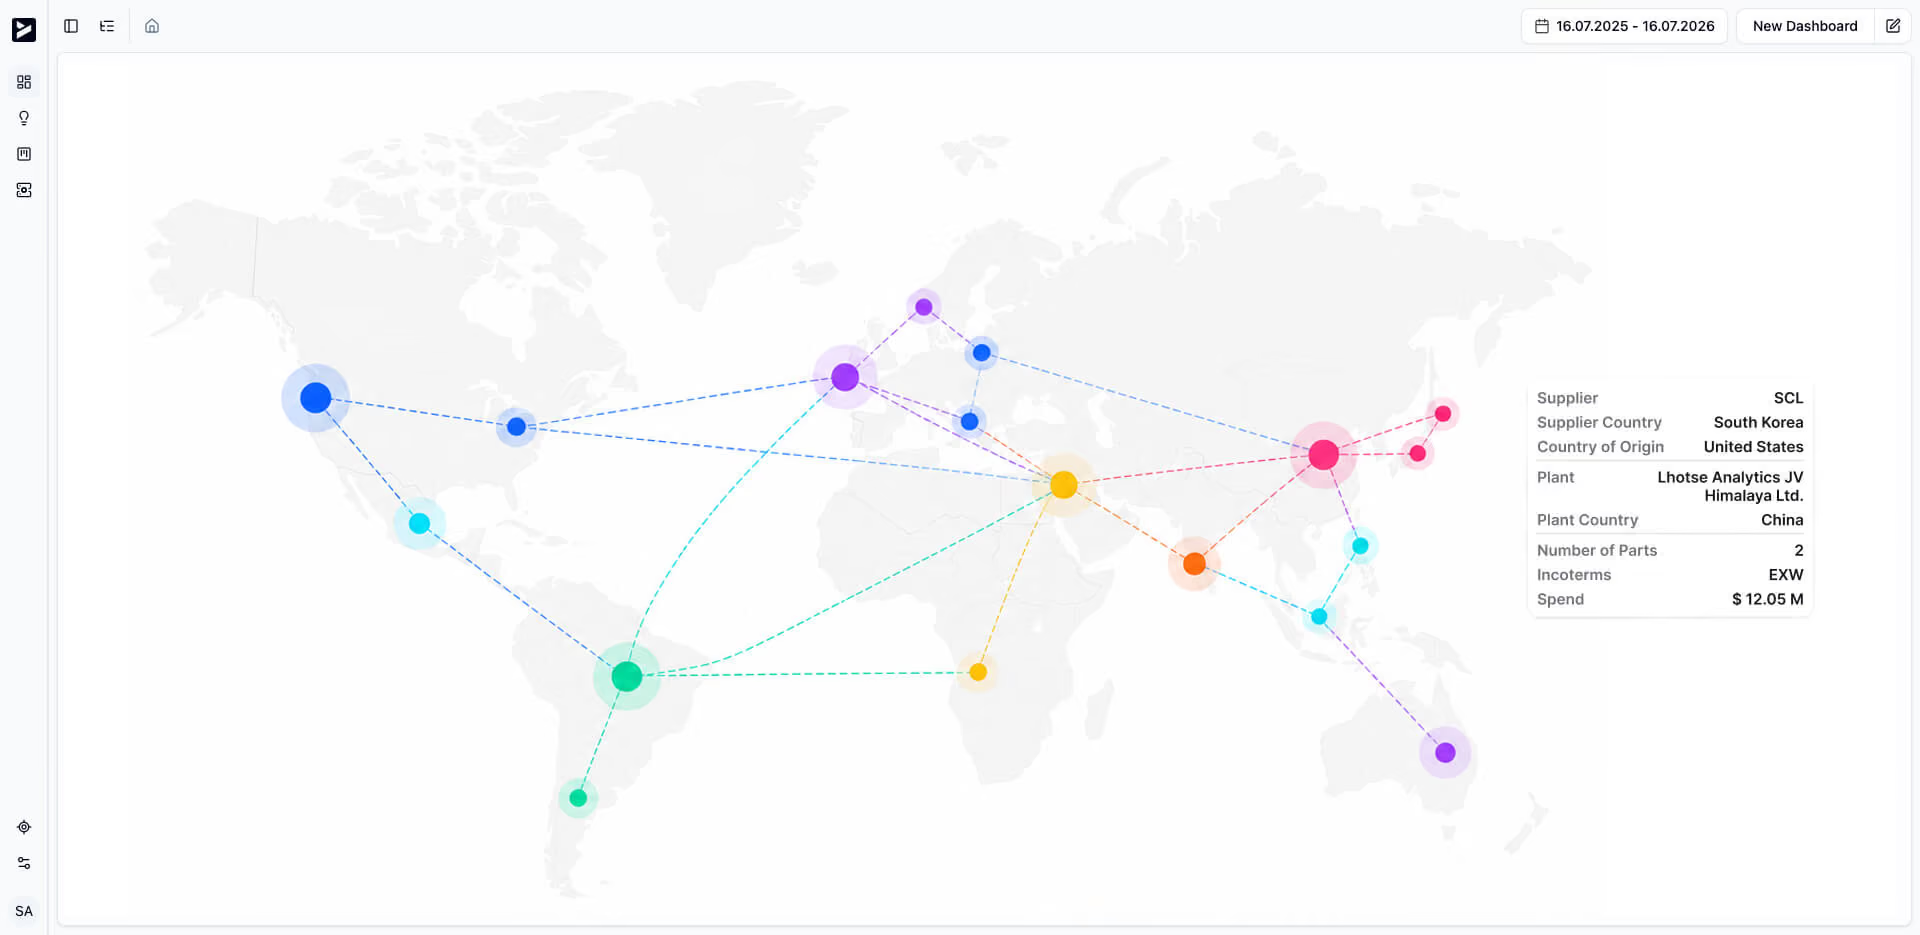
The "Supply chains" function visualizes the complex supply chains of your direct suppliers. It provides insight into the supply flows from the supplier's plant to your production sites. In the event of geopolitical crises, force majeure or ailing suppliers, you can obtain an overview of potential risks or regions.
Discover the benefits
- Standardized data as a basis for quick decision-making
- Time savings through standardization and automation of data preparation
- Immediate access to data through centralization in a single source of truth




With ivoflow, we found a partner that understands procurement not only from a technology perspective, but also from a business perspective. In addition to the strength of the solution itself, we were particularly impressed by the team’s procurement expertise. ivoflow quickly understood where we stand as an organisation, which challenges we need to address, and what we want to achieve. The platform gives us transparency across our global spend, regardless of which ERP system the data comes from, and helps us identify and realise savings opportunities in a targeted way. The open exchange at eye level, combined with a straightforward and trusting way of working together, helped us implement the solution efficiently and start seeing value early on.








See how ivoflow works
Experience firsthand how our AI-powered solution can streamline your workflow and boost efficiency.
Try Our DemoFAQ
What is spend analytics in procurement?

Spend analytics is the systematic process of collecting, categorizing, cleansing and analyzing a company's procurement spend. The result is transparency over cost structures and cost drivers, which makes it possible to identify savings potential. Procurement and finance departments use spend analytics to increase efficiency, ensure compliance and strengthen their negotiating position with suppliers. Spend analytics also uncovers risk: which spend can be consolidated, and which suppliers show signs of financial instability. A prerequisite for successful spend analytics is a single source of truth – direct access to all procurement data instead of exporting it from multiple systems. This single source of truth is often provided by spend analytics software that aggregates and centralizes the data. Spend analytics primarily answers where and with whom money is spent. Economic cost drivers behind individual supplier prices – such as raw materials, energy or currencies – fall outside its classic scope.
What is AI in spend analytics?
AI in spend analytics combines spend, supplier performance and market data into a single view, enabling data-driven sourcing and negotiation strategies instead of manual, siloed reporting. It also enables scenario modeling: procurement teams can simulate cost, risk and pricing levers and evaluate their impact before making a decision. Traditional spend analytics tools mainly report on historical spend by supplier and category. AI spend analytics adds a layer on top: it links that spend data to external and internal signals — supplier performance, market indices, and raw material, energy or currency movements — so procurement sees cause and effect, not just totals. Scenario modeling then lets teams test "what if" levers, for example renegotiating a supplier contract or switching a cost index, and quantify the resulting impact on cost, risk and value before acting.
Is ivoflow a spend analytics tool?
No. Spend analytics explains where money is spent; ivoflow is a spend and price intelligence platform built for direct, recurring procurement. Spend analytics is one feature within the platform — alongside price analysis that shows which supplier prices are no longer economically justified as raw materials, energy or currencies change. Classic spend analytics tools report on historical spend, supplier structures and categories. ivoflow adds price intelligence on top: it connects spend data to external cost indices to identify price deviations and prepare supplier negotiations with quantified savings potential.
Can ivoflow also cover indirect spend analytics?
Yes, indirect spend can be mapped as a complementary layer. ivoflow's core strength, however, lies in direct material: analysis at the level of material number, plant, supplier, purchase order and goods receipt. For a broader spend view, free-text orders and invoices without a purchase order reference can also be integrated. Indirect spend analytics covers non-production purchases — such as marketing, IT, facilities, travel or professional services — that don't go directly into a company's end product. It typically requires different data structures and category models than direct spend analytics, since indirect categories are more fragmented and harder to classify consistently. ivoflow is not a standalone indirect spend or classic spend analytics solution: its focus is direct material in recurring/series procurement, where purchasing costs typically account for 50–70% of total costs in manufacturing industries.
What is a spend cube?
A spend cube is a multidimensional representation of a company's procurement spend along three axes: what was purchased (category), from whom (supplier), and by whom (internal unit such as department, cost center or location). This structure makes it possible to analyze spend from multiple angles at once — for example, how much a specific location spends with a specific supplier for a specific category. The spend cube is the central analytical model behind every spend analytics solution. It surfaces patterns that stay hidden in a simple table, such as supplier consolidation potential, price differences between locations or departments, and maverick buying.
What is spend analytics software?
Spend analytics software is a software solution that helps companies analyze and optimize their spend. It automates data aggregation, cleansing and analysis to provide insight into cost structures and savings potential as a basis for data-based decisions. The choice of spend analytics software depends on specific procurement requirements, budget, and how well it integrates into the company's existing system landscape. Classic spend analytics software maps spend, supplier structures and categories. AI-powered Platforms built for recurring/series procurement go one step further: they connect purchasing data to external cost indices such as raw materials, energy or currencies, and show how supplier prices change economically over time.

Talk to our co-founder Nick.
As Co-Founder of ivoflow and with more than a decade of procurement experience, Nick knows which levers can create the biggest impact across different procurement organizations.Unsure how your team could benefit from our toolbox? Schedule a quick chat with Nick.
15-minute call with Nick

Want to know more
about our procurement solution?
Let us show you how ivoflow can support your business. We are ready to showcase our procurement management system. Together we will find the perfect solution for your company. Feel free to give us a call or e-mail us today!
Save your power and
empower your savings.